Benchmarks
Test dataset
Section titled “Test dataset”84M paired-end reads — Buckberry et al. 2023 SRR24827373 (whole-genome bisulfite sequencing, ~4.4 GiB gzipped, R1 + R2 combined). Outputs verified byte-identical (decompressed) between Rust beta.5 and beta.7 across all core counts via md5 checksums — Myers' prefilter is byte-identity-preserving by construction.
At a glance
Section titled “At a glance”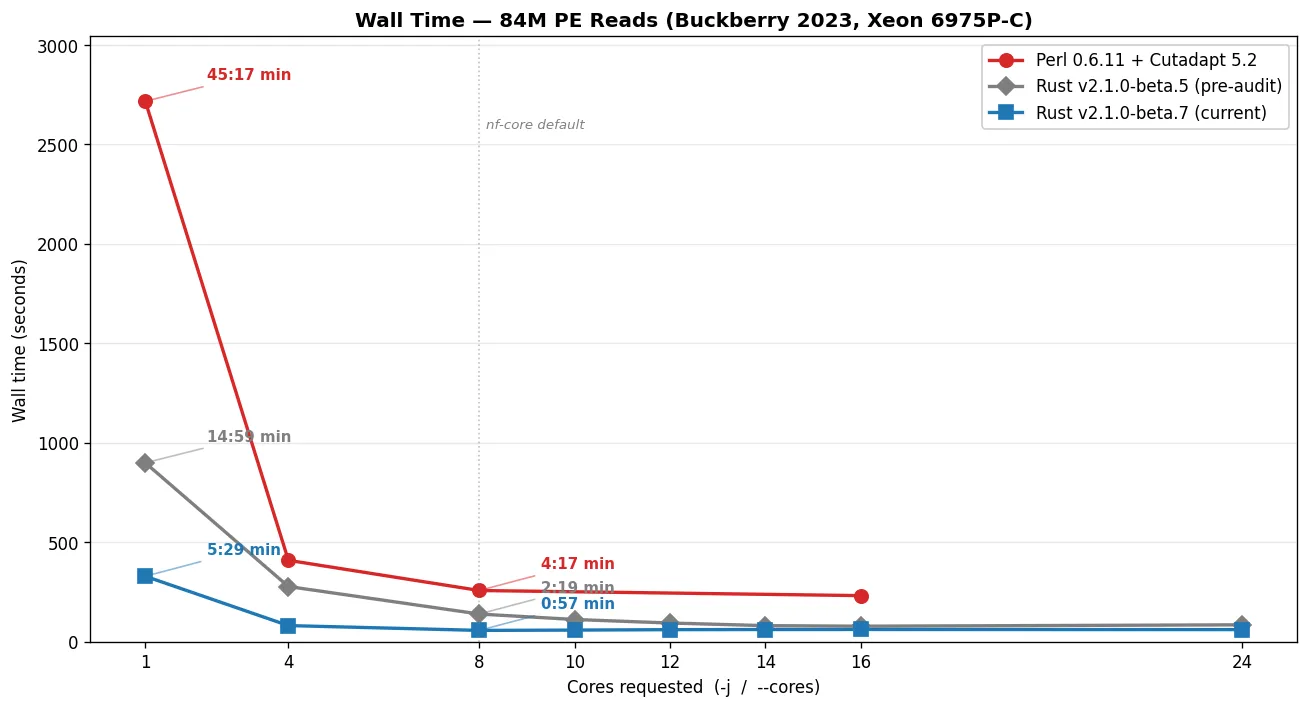
Charts regenerate from ~/perf_data/2026-04-29/*.json via python3 docs/scripts/generate-benchmark-charts.py --data <dir> --out docs/src/assets/benchmarks/. Re-run as additional matrix points (Perl c8/c16, Rust extras c10/12/14) land.
Server benchmark: Intel Xeon 6975P-C (dockyard-oxy-0)
Section titled “Server benchmark: Intel Xeon 6975P-C (dockyard-oxy-0)”Tested with hyperfine --warmup 1 --runs 10 per condition. CPU time is user + system summed across all OS threads (i.e., what cluster billing dashboards report).
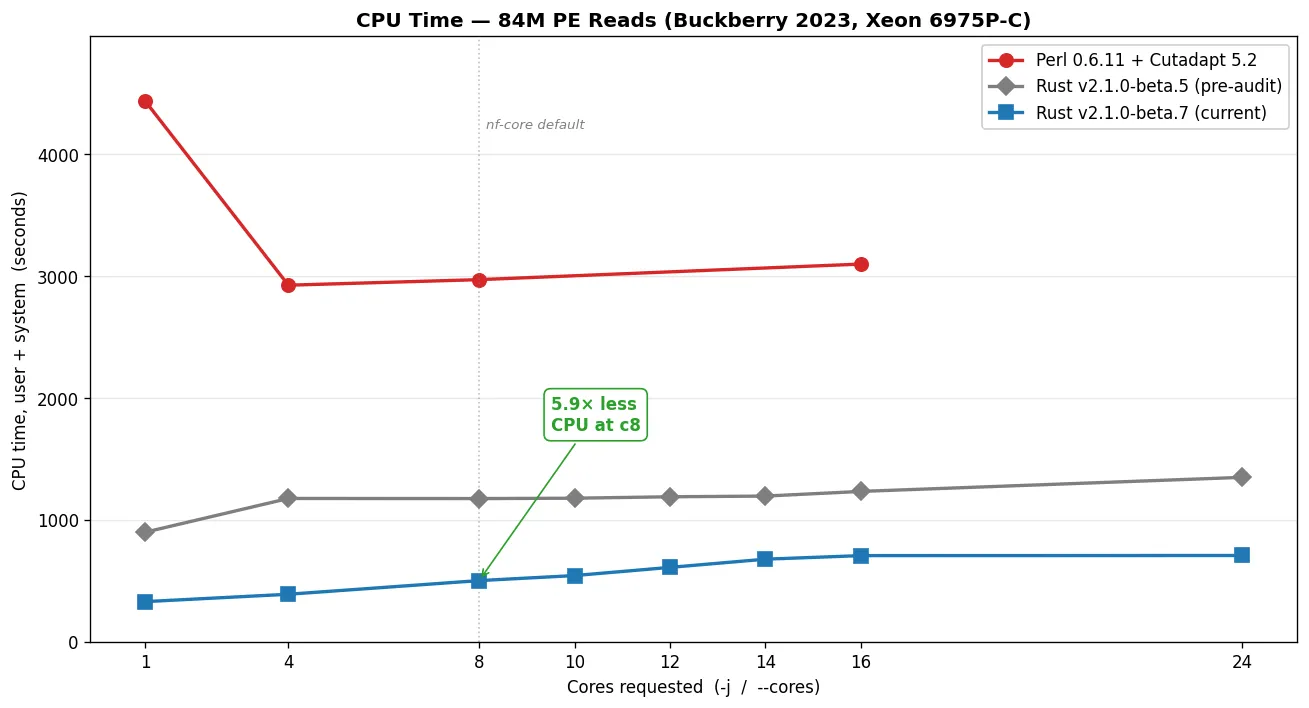
Trim Galore v0.6.11 (Perl 5 + Cutadapt 5.2 + igzip + pigz)
Section titled “Trim Galore v0.6.11 (Perl 5 + Cutadapt 5.2 + igzip + pigz)”-j | Wall time | CPU time |
|---|---|---|
| 1 | 45:17 (2,717s) | 4,437s |
| 4 | 6:49 (409s) | 2,927s |
| 8 | 4:17 (257s) | 2,972s |
| 16 | 3:51 (231s) | 3,100s |
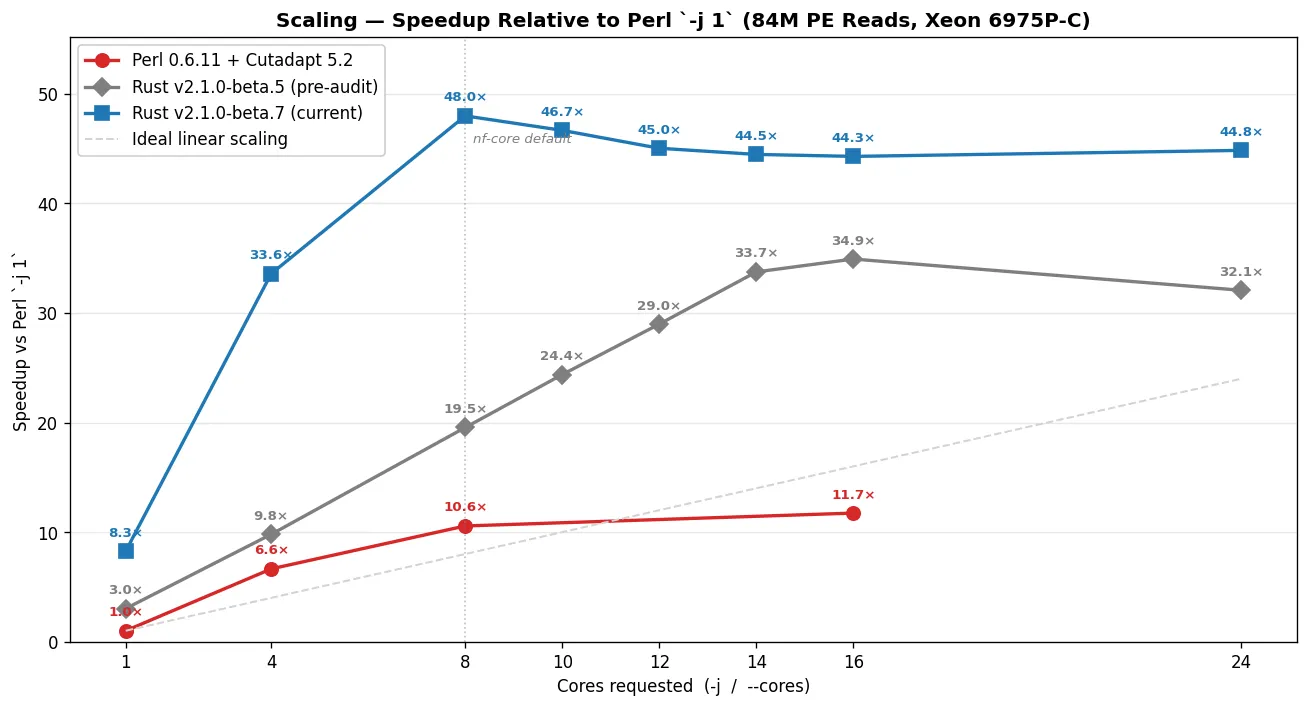
Perl saturates around -j 8: going from -j 8 → -j 16 shaves only 10% off wall time (257s → 231s) while CPU usage goes up 4% (2,972s → 3,100s) from thread-overhead. Past -j 8, you pay more cluster-hours for marginal speed.
Trim Galore v2.1.0-beta.5 (Rust, pre-Buckberry-audit baseline)
Section titled “Trim Galore v2.1.0-beta.5 (Rust, pre-Buckberry-audit baseline)”This is the "v2.0-era" Rust binary — published to crates.io before the post-audit optimizations landed. It's the right reference for what shipped before the Buckberry-scale audit drove the next round of perf wins.
--cores | Wall time | CPU time |
|---|---|---|
| 1 | 14:59 (899s) | 899s |
| 4 | 4:37 (277s) | 1,176s |
| 8 | 2:19 (139s) | 1,175s |
| 10 | 1:51 (111s) | 1,178s |
| 12 | 1:34 (94s) | 1,190s |
| 14 | 1:21 (81s) | 1,195s |
| 16 | 1:18 (78s) | 1,233s |
| 24 | 1:25 (85s) | 1,349s |
Trim Galore v2.1.0-beta.7 (Rust, post-Myers' prefilter — current)
Section titled “Trim Galore v2.1.0-beta.7 (Rust, post-Myers' prefilter — current)”Includes three optimizations from the Buckberry-scale audit (co-authored with @an-altosian):
- Output gzip level 6 → 1 (beta.6) — sheds compression CPU at saturation; ~75% larger output bytes traded for ~2× faster trimming on multi-core runs.
- Single buffered write per
FastqRecord(beta.6) — collapsed 4×writeln!into onewrite_all. - Myers' bit-parallel adapter alignment prefilter (beta.7) — short-circuits the scalar DP when no match within the error budget is possible. Conservative wrapper, byte-identity-preserving by construction.
--cores | Wall time | CPU time | vs beta.5 wall | vs beta.5 CPU |
|---|---|---|---|---|
| 1 | 5:29 (329s) | 329s | 2.74× faster | 2.73× less |
| 4 | 1:21 (81s) | 389s | 3.43× faster | 3.02× less |
| 8 | 0:57 (57s) | 501s | 2.46× faster | 2.34× less |
| 10 | 0:58 (58s) | 543s | 1.91× faster | 2.17× less |
| 12 | 1:00 (60s) | 610s | 1.55× faster | 1.95× less |
| 14 | 1:01 (61s) | 677s | 1.32× faster | 1.77× less |
| 16 | 1:01 (61s) | 706s | 1.27× faster | 1.75× less |
| 24 | 1:01 (61s) | 707s | 1.40× faster | 1.91× less |
Version-to-version: post-audit wall-time wins
Section titled “Version-to-version: post-audit wall-time wins”Combined wall-time improvements at the headline core counts on Buckberry:
--cores | beta.5 wall | beta.7 wall | Wall reduction |
|---|---|---|---|
| 1 | 899s | 329s | −63.4% |
| 4 | 277s | 81s | −70.8% |
| 8 | 139s | 57s | −59.3% |
Both versions hit the gzip-output I/O bottleneck on the disk overlay, but at very different core counts. beta.7 saturates at --cores 8 — wall stays essentially flat from c8 → c14 (57s → 58s → 60s → 61s) while CPU climbs from 501s to 677s as extra workers pay coordination overhead without buying speed. beta.5 saturates around --cores 14-16 — wall keeps dropping (139s → 111s → 94s → 81s → 78s) all the way through c14, then plateaus. beta.7 hits the I/O wall earlier because it's faster per-thread; the per-second write throughput on /tmp becomes binding before extra workers run out of useful per-read work to do.
Head-to-head: Perl 0.6.11 vs Rust v2.1.0-beta.7
Section titled “Head-to-head: Perl 0.6.11 vs Rust v2.1.0-beta.7”| Cores | Perl wall | Rust wall | Wall speedup | Perl CPU | Rust CPU | CPU savings |
|---|---|---|---|---|---|---|
| 1 | 2,717s | 329s | 8.26× | 4,437s | 329s | 13.49× |
| 4 | 409s | 81s | 5.06× | 2,927s | 389s | 7.52× |
| 8 | 257s | 57s | 4.54× | 2,972s | 501s | 5.93× |
| 16 | 231s | 61s | 3.77× | 3,100s | 706s | 4.39× |
Production comparison: nf-core default (--cores 8)
Section titled “Production comparison: nf-core default (--cores 8)”In nf-core pipelines, Trim Galore is typically allocated 12 CPUs (process_high) and run with -j 8 (the module subtracts 4 for overhead). With -j 8, TG spawns up to ~27 threads across Cutadapt workers, pigz compression, and pigz/igzip decompression. nf-core installs TG from bioconda, which includes igzip (Intel ISA-L) for decompression.
TG -j 8 | Rust --cores 4 | Rust --cores 8 | Rust --cores 24 | |
|---|---|---|---|---|
| Wall time | 257s | 81s (3.17× faster) | 57s (4.54× faster) | 61s (4.21× faster) |
| CPU time | 2,972s | 389s (7.64× less) | 501s (5.93× less) | 707s (4.20× less) |
| Threads | up to ~27 | 8 (deterministic) | 12 (deterministic) | 28 (deterministic) |
Three ways to read this:
- Smallest CPU footprint: Rust
--cores 4(8 threads, 389s CPU) already finishes 3.17× faster than TG-j 8while using 7.64× less CPU. Best choice when CPU/cluster-hours are the constraint. - Headline speed at saturation: Rust
--cores 8(12 threads) finishes in 57 seconds — 4.54× faster than TG-j 8at 5.93× less CPU. The cleanest apples-to-apples cores-vs-cores comparison; this is the number nf-core users see. - Maximum throughput at comparable thread budget: Rust
--cores 24(~28 threads) vs TG-j 8(~27 threads). Finishes in 61 seconds, 4.21× faster at 4.20× less CPU. Diminishing returns past--cores 8because gzip-output I/O is the bottleneck.
Laptop benchmark: Apple M1 Pro (10 cores, 32 GiB)
Section titled “Laptop benchmark: Apple M1 Pro (10 cores, 32 GiB)”Same Buckberry SRR24827373 fixture (84M PE reads, 4.4 GiB gzipped), Trim Galore v2.1.0-beta.7 (Apple Silicon native build via cargo install). Methodology: hyperfine --warmup 1 --runs 3 per condition — intentionally lighter than the server-side --runs 10 since the goal is a directional cross-platform datapoint, not paper-grade rigor. Cores ladder stops at 6 (of 10 physical) to leave headroom for the OS and other applications. Raw data: docs/perf_data/buckberry-2026-04-30-laptop/.
--cores | Wall time | CPU time | Speedup vs c1 |
|---|---|---|---|
| 1 | 7:36 (456s) | 430s | 1.00× |
| 2 | 3:41 (221s) | 482s | 2.07× |
| 4 | 1:52 (112s) | 487s | 4.07× |
| 6 | 1:20 (80s) | 501s | 5.73× |
At --cores 6, the laptop finishes 84M PE reads in 80 seconds. That's within ~40% of the server-side cores=8 saturation point (57s on Granite Rapids) — Apple M1 Pro is ~38% slower per-core than Xeon 6975P-C, and the gap is consistent across the ladder (laptop c1: 456s vs server c1: 329s; laptop c4: 112s vs server c4: 81s).
The Perl 0.6.11 reference for this hardware is omitted from this run for time reasons — Perl c1 on Buckberry takes ~45 minutes per iteration, so even 3 iterations × 4 cores values is roughly a 6-hour run on a laptop. The cross-engine ratios from the server table (e.g. 5.93× less CPU at cores=8) hold here directionally — Perl's three-process pipeline architecture has the same I/O bottlenecks regardless of CPU family.
Cost and CO₂
Section titled “Cost and CO₂”CPU time is what cloud providers bill for and what drives energy consumption. Trim Galore v2.1.0-beta.7 uses 5.9× to 13.5× less CPU time than Perl Trim Galore for the same job, depending on the core count:
| Scenario | Perl CPU time | Rust v2.1.0-beta.7 CPU time | CPU savings |
|---|---|---|---|
| Single-threaded | 4,437s | 329s | 13.49× |
| 8 cores (nf-core default) | 2,972s | 501s | 5.93× |
On AWS at ~$0.05/vCPU-hour, trimming 84M PE reads at the nf-core default costs roughly $0.041 with TG vs $0.007 with the Rust v2 build — a 5.9× saving per sample. Across a 1000-sample cohort that scales to ~$41 with TG vs ~$7 with Rust v2, with proportional savings in carbon footprint and shared-cluster CPU-hour pressure.
Output file size
Section titled “Output file size”The default output gzip level is 1 (fastest), this is what the headline numbers above measure. The trade is that output .fq.gz files are roughly 75% larger than gzip-level-6 output (the older Perl/gzip(1) default). Decompressed bytes are byte-identical regardless of level — all gzip levels are lossless; only the framing differs.
Two opt-in flags shrink the output: --clumpify and --compression. They can be used indepedently or together. For some data types they can give up to 50% smaller FastQ files with zero data loss.
The --clumpify flag instructs Trim Galore to roughly sort your data by sequence before compression, making the gzip compression more effective. Whether to use it or not depends on your data type.
See Clumpy compression for the full per-data-type table.
Methodology
Section titled “Methodology”- Timing: All wall time and CPU time measured via
hyperfine --warmup 1 --runs 10per condition. CPU time = user + system, summed across all OS threads. - Raw data: All 20 hyperfine JSON outputs, the markdown summaries, the byte-identity cross-check report, and the run logs are committed to the repo at
docs/perf_data/buckberry-2026-04-29/— anyone can verify the numbers in the tables above against the source data. - Reproducer:
scripts/benchmark.sh— drives the full matrix (Rust beta.5/beta.7 at cores 1/4/8/10/12/14/16/24; Perl 0.6.11 + Cutadapt 5.2 at cores 1/4/8/16) withhyperfine --warmup 1 --runs 10. Includes a cross-version byte-identity check at the end (beta.5 vs beta.7 cores=8 outputs). - Thread counts (TG): Approximate peak values from architectural reasoning (Cutadapt workers + pigz compression workers + igzip/pigz decompression). Threads are spawned across three independent subprocesses whose lifetimes may not fully overlap.
- Thread counts (Rust v2): Deterministic from the architecture: exactly N+4 threads for
--cores N(N workers + 2 decompressors + 1 batcher + 1 writer), or exactly 1 thread for--cores 1. - igzip: The bioconda Trim Galore installation includes igzip (Intel ISA-L) for fast single-threaded decompression. Benchmarks run with igzip available to match the nf-core production environment.
- Outputs verified: All Rust beta.5 and beta.7 outputs were confirmed byte-identical (decompressed) at
--cores 8via md5 checksums. Myers' prefilter is byte-identity-preserving by construction.
For the architectural reasons behind the numbers (single-pass vs three-pass architecture, worker-pool parallelism, thread-budget breakdown), see Threading model.